The concessions manager at a professional indoor soccer team's stadium needs to be able to predict attendance several days before home games (in order to make staffing decisions), and to refine those predictions on the morning of game day (when food must be defrosted and sent from off-site to the stadium).
The quality of the incoming opponent (measured by that opponent's recent winning percentage), as well as the amount (in dollars) of advertising planned by the team's owners over the days leading up to a game, are known to him well in advance of game day. On the morning of game day, he can, of course, observe whether it's clear ("weather"=0) or raining ("weather"=1).
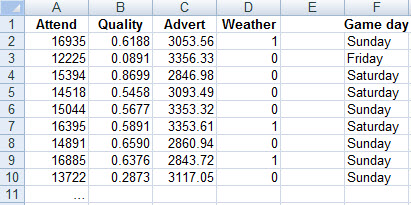
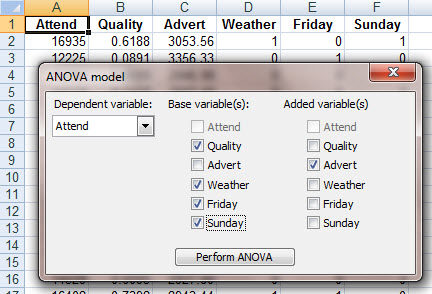
All home games are played on either Friday evening, or Saturday or Sunday afternoon. Data collected over the past 40 home games is available here, and some of it is exhibited below:
Ignoring game day for the moment, regressing attendance onto the first three explanatory variables yields these results:
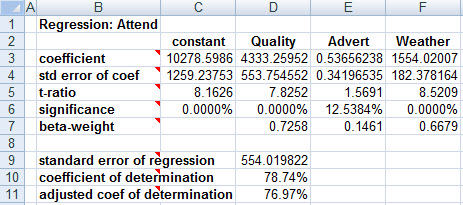
Were there no other variables to consider, this would suggest that fans like to see good opponents, and that rain brings more fans to the stadium (perhaps because it brings in those with planned-but-now-cancelled outdoor activities, seeking an indoor event to attend). As well, it appears that advertising does fill additional seats. However, the correlation matrix shows a curious phenomenon:
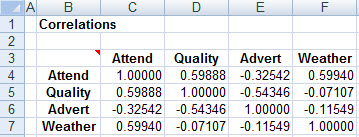
The correlation between advertising and attendance is negative!
[Backstory: I made up this dataset in the spring of 1998. The Chicago Bulls were heading for their sixth NBA championship, and many expected that Michael Jordan would retire at the end of the season. I read an article one day which noted that the Bulls' road games were all sell-outs: Fans in other cities were turning out in droves for what could be their last chance ever to see Jordan play. I thought to myself, "Sensible owners, expecting free advertising from local sportswriters and sportscasters and loads of fan excitement, won't waste money advertising when the Bulls come to town. Instead they'll spend their media budgets advertising the less-exciting home games against other opponents. The advertising will bring additional fans to the stadium, but won't generate sellouts -- and as a result, advertising and attendance could end up being negatively correlated." I chose to capture this in an exam dataset.]
The phenomenon is explained (without need to know the backstory) by considering the correlations between the explanatory variables: Apparently, the most advertising is being done against low-quality teams, and (from the regression) low-quality teams don't draw many fans to the stadium. Advertising helps (again, from the regression), but not enough to fully offset the low-quality-induced reduction in attendance.
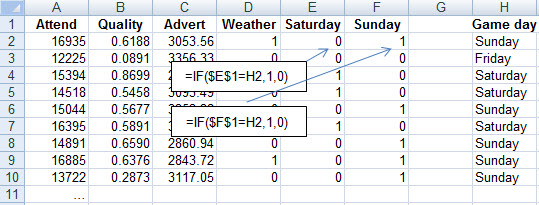
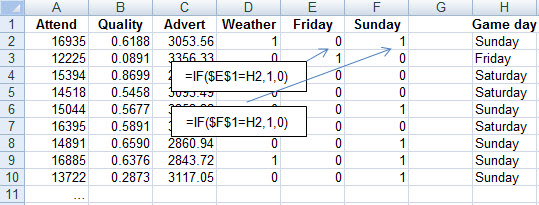
How might we bring game-day into the regression model? By selecting one of the three possibly game days as our "foundation" case, and creating two dummy variables which indicate whether a game is played on one of the two non-foundation days.
Taking Friday as the foundation case, we create "Is the game played on Saturday?" and "Is the game played on Sunday?" variables. One way to do this in a spreadsheet is illustrated below:
Here's the resulting regression:
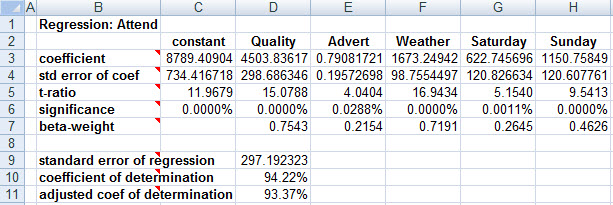
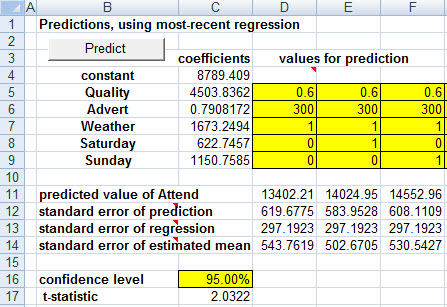
As the predictions below show, the pure game-day-related difference between playing on a Friday, Saturday, or Sunday is that Saturdays draw 622.75 more attendees (on average) than do Fridays, given the same opponent quality, advertising, and weather. And Sundays outdraw Fridays by 1150.76 (and consequently outdraw Saturdays by 528.01.
In order to confirm that our encoding of game day didn't bias our results, let's recode, with Saturday as the foundation case:
In the new regression, the coefficients of the dummy variables are rearranged, but ultimately convey precisely the same message as before.

When we play this modeling trick, using a collection of dummy variables to represent one qualitative variable, one new issue arises: The significance levels of the individual dummy variables don't really tell us whether there's evidence (or not) supporting the inclusion of the qualitative variable (i.e., all of the dummy variables) in our model. If some of the individual significance levels are near 0, and others are large, what conclusion can we draw?
Fortunately, a technique known as "analysis of variance" (abbreviated ANOVA) answers this question. Imagine the variables in the model separated into two groups: the base group (of everything other than the dummy variables representing one qualitative variable), and the added group of dummy variables.
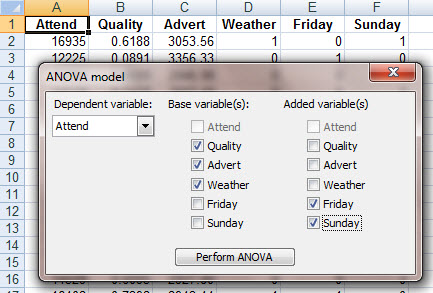
Hypothesize that the true coefficients of all of the added variables are 0, i.e., there's nothing amongst them that belongs in the model. Then the significance level of the sample data, with respect to this null hypothesis, is found at the lower right-hand corner of the ANOVA table (cell G10 on the ANOVA tab in KStat).
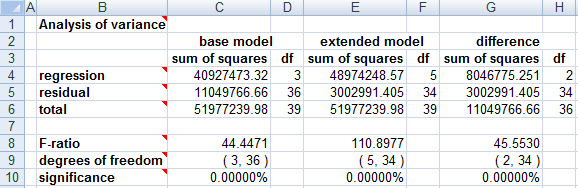
In the current case, that significance level is so close to zero that its first four decimal places are all 0, and we therefore conclude that the data overwhelmingly contradicts the null hypothesis, and supports the alternative statement that game day does belong in our model.
ANOVA directly generalizes the significance level we've previously looked at in the regression output. For example, using the ANOVA option to ask whether there's evidence that advertising belongs in our final model,
we obtain:
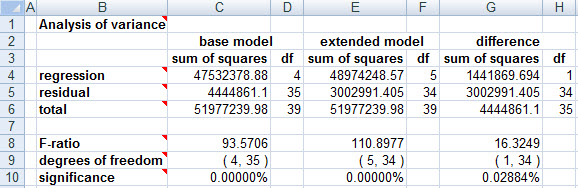
i.e., precisely the same significance level of 0.0288(4)% that we did in the regression.